Relative Strength Index (Log/Divs/MTF/EMA)RSI calculated for log scale, with divergences labeled, as well as a 1 hour 55 EMA for signal.
Original log-space RSI by fskrypt.
Divergences taken from JustUncleL, originally from RicardoSantos.
Cari dalam skrip untuk "relative strength"

Relative Strength Index + Moving Average + Colors
Standard RSI already stylized
Standard Overbought and Oversold line stylized + middle line
Moving Average, can set length and exponential or simple
MA can be colored based on direction
MA has crosses when yellow, likely soon before a reversal

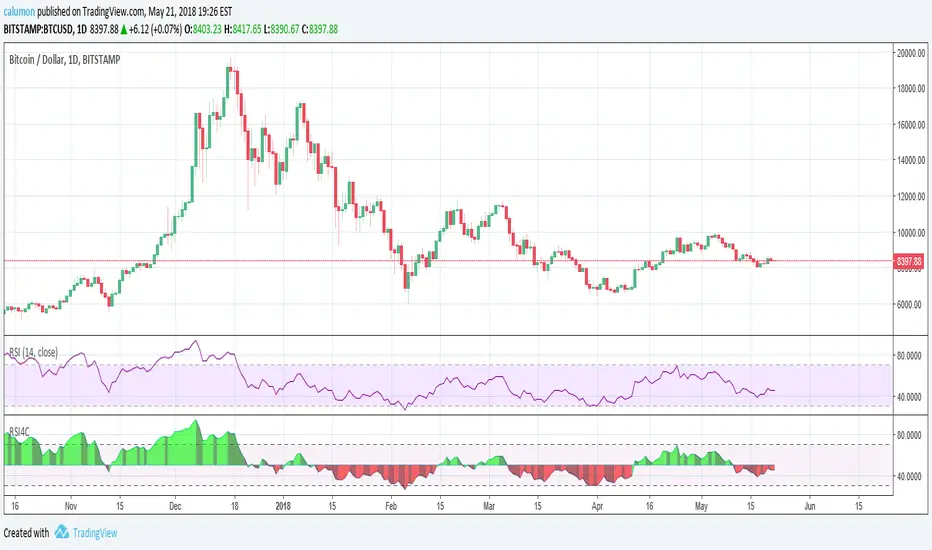
Relative Strength Index with 4 ColorsThe values used by this indicator are equal to RSI 14. Only changes are made to looks:
If RSI is above 50%, then we are seeing green. Else, we are seeing red.
Another point is that depending on whether the RSI increases or decreases, we get two different color tones.
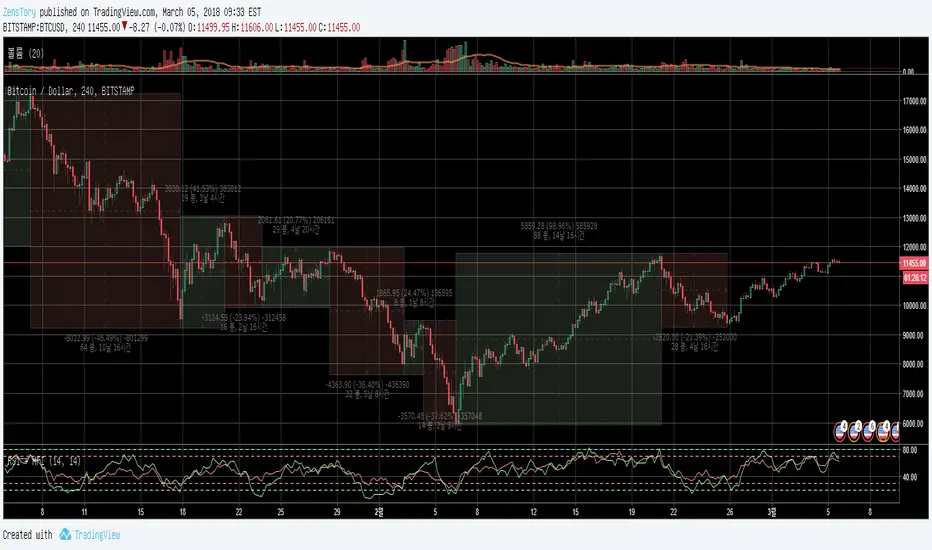
Relative Strength Index low-EMA-BarcolorA rsi to discover big candles to the down side. Ths indcator takes the wigs in account.

Relative Strength Index hl2-EMA-BarcolorThe classical rsi is based upon the closing of candes. At a lower timeframe this is not a problem, but on a higher timeframe the big swings of candles do not represent the full scope of movement. Hence this indicator is build to capture these swings to. Also this indicator adds a barcolor.


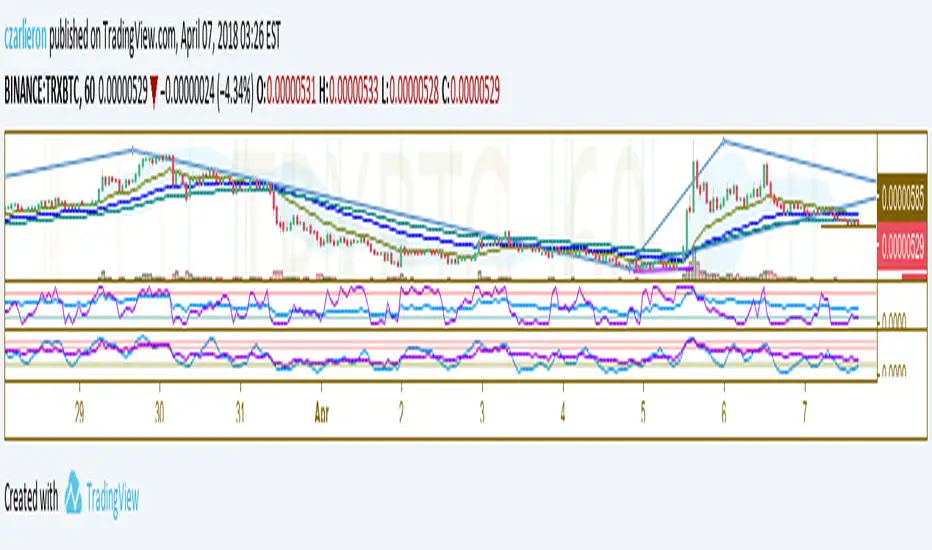
Relative Strength Index + MFI breachI allowed myself to take a piece of code of one of the indicators MFI present on Tradingview for the added to a RSI!
I made this srcipt to avoid cluttering the screen, so we can see the oversold / overbought of the MFI without having any additional indicator


Relative Strength Money Flow RibbonThis is a hybrid of both the RSI and MFI indicators.
Includes options to show coloured alert bars when threshold limits are reached.
Includes:
RSI indicator - yellow line
MFI indicator - green line
Customisable limits include:
Top threshold - 80
Upper limit - 70
Middle line - 50
Lower limit - 30
Bottom limit - 20

Relative Strength Money Flow RibbonThis is a Hybrid of the RSI and MFI indicators.
It also shows coloured alerts when extreme conditions are met.


Relative Strength Index with SMADetect reverse point, buy when SMA is comming up and RSI cross up SMA

Relative Strength Index (Color mod)Changed opacity of center band and added green to plot line above 70 and red to plot line below 30.


Relative Strength & sma delta2 RSI with different length at your choise, with 2 sma signal. 4 Plots show the difference between the 2 RSI and 2 Signals , the difference of the 2 RSI and the difference of the Delta of the 2 RSI. So you can have a close view toghether with a bird s eye view. The black line is the middle way.


Relative Strength Index x2Two RSI better then one. Also histogram shows difference of fast and slow RSI.
